|
|
Color ParametersColors can be specified in any NetCharts parameter using any of the following values:
Predefined Color Name Hexdecimal RGB value NULL Keyword Predefined color names are the most convenient method for specifying a color and over 100 names are supported.
Note: If a specific RGB value is required, they can be specified using the following format: xRRGGBBwhere RR, GG, BB are the hexadecimal values for red, green, and blue, in the range 00 to ff. The leading 'x' is mandatory and designates the beginning of the hexadecimal value. The NULL keyword may also be used depending on the specific chart parameter being defined. For example, the DataSets parameter in the NFBarchartApp accepts a NULL parameter, whereas the Background parameter DOES NOT accept NULL colors. Currently, the following parameters accept the NULL keyword as a color value for the given attributes:
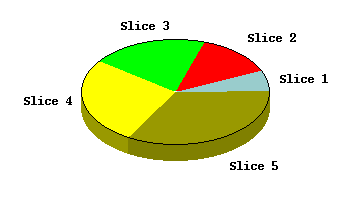
In all of these cases, whenever the NULL keyword is specified as a color value, the actual color used will be determined automatically from the default color table. That is, a default color will be selected, based on the index of the parameter being defined. For example, the following parameters specify default colors for all but the first and last slices in a piechart:
Slices = (10, lightsteelblue, "Slice 1", black, "Courier", 12),
         (20, NULL, "Slice 2"),
         (30, NULL, "Slice 3"),
         (40, NULL, "Slice 4"),
         (50, darkyellow, "Slice 5");
The system default color table contains 10 colors, which are reused as needed depending on the number of datasets being defined. The default color table can be completely specified in all NetCharts chart applets using the ColorTable parameter, which is defined as follows:
ColorTable = color1, color2, color3 ...;
In that case, the colors will "wrap-around"
whenever the number of data sets exceeds the number of colors defined
in the ColorTable parameter.
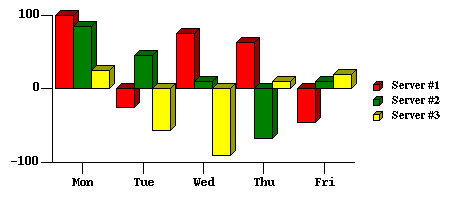
In this example, a custom color table is defined and used to specify the color for each data set in a barchart with more than one data set.
ColorTable = red, green, yellow, lightblue;
DataSets   = ("Server #1", NULL),
             ("Server #2", NULL),
             ("Server #3", NULL);
DataSet1   = 100, -25, 75, 63, -46;
DataSet2   = 85, 45, 10, -67, 10;
DataSet3   = 25, -56, -90, 10, 20;
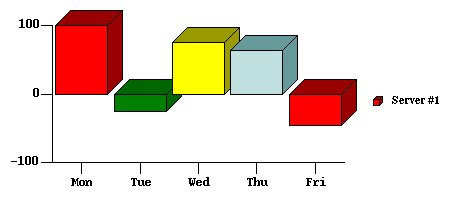
In this example, a custom color table is defined and used to specify the color for each bar in a single data set barchart. See Barchart for more details concerning the use of NULL colors.
ColorTable = red, green, yellow, lightblue;
DataSets   = ("Server #1", NULL);
DataSet1   = 100, -25, 75, 63, -46;
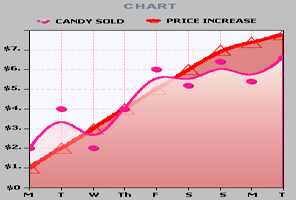
Pattern FillsClick here for Chart Specific Pattern Fill CDL Parameters Translucent ColorsThe following chart uses a vertical gradient and translucent color for one LineFillPattern. LineFillPattern = (GRADIENTVERTICAL,pink_10,linen),(BSLASH,rosybrown,lightcoral);
|


